Intercept only fits
intercept_only.RmdIntercept only fits should be done setting
intercept = TRUE and using NULL for the left
side of the formula.
library(lnmixsurv)
library(dplyr)
library(tidyr)
library(readr)

mod1 <- survival_ln_mixture(Surv(y, delta) ~ NULL,
  sim_data$data,
  iter = 4000,
  warmup = 2000,
  intercept = TRUE,
  starting_seed = 15,
  em_iter = 50,
  mixture_components = 3
)

chains <- bayesplot::mcmc_trace(mod1$posterior)
We can easily see the chains with the mcmc_trace()
function from bayesplot package. Since it’s just an
example, we don’t expect that the chains have already converged.
bayesplot::mcmc_trace(mod1$posterior)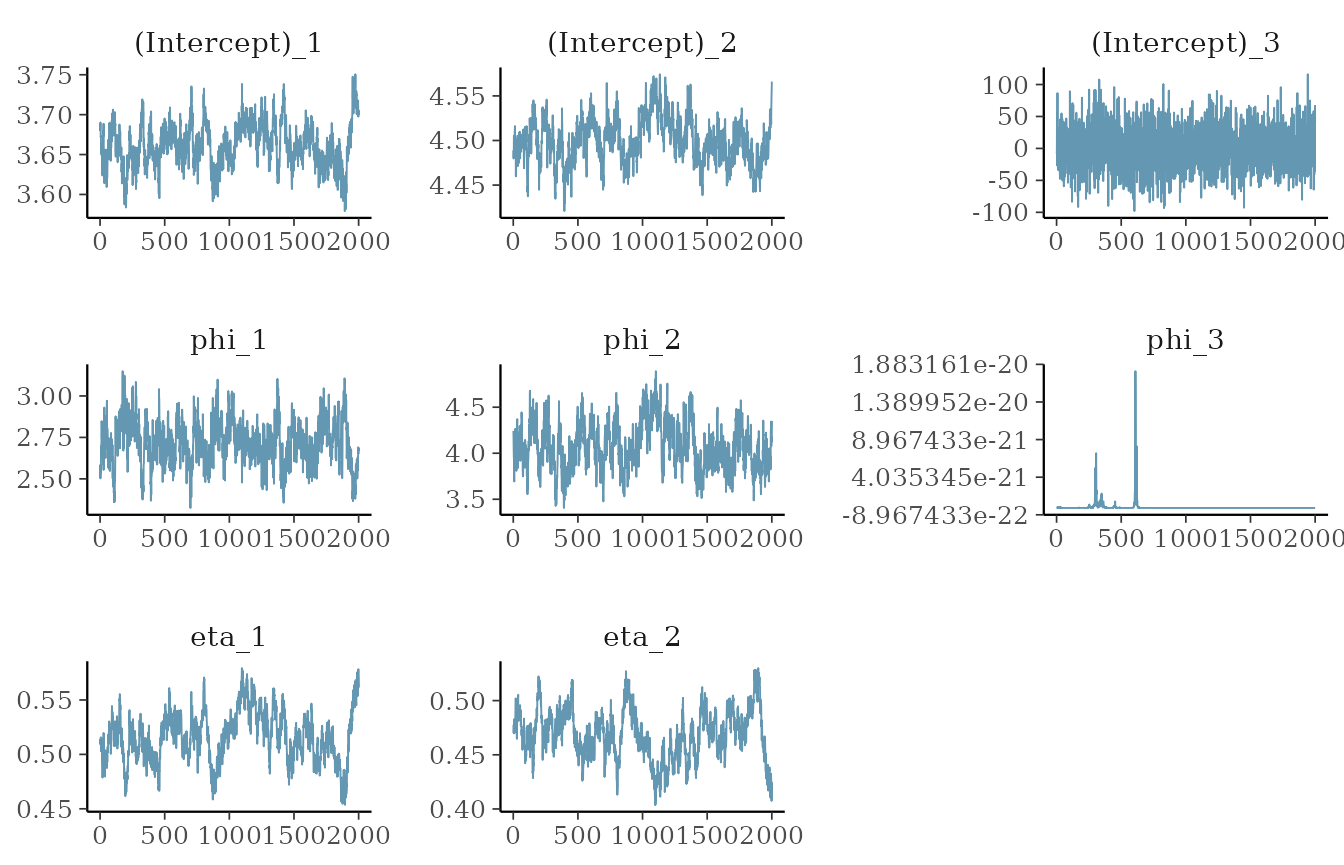
Furthermore, we can use the ggplot2 package to visualize
the Kaplan-Meier survival estimates, created with the
survfit() function from the survival package
and the tidy() function from the broom
package.
km <- survival::survfit(
  Surv(y, delta) ~ NULL,
  sim_data$data
) |>
  broom::tidy() # Kaplan-Meier estimate

ggplot(km) +
  geom_step(aes(x = time, y = estimate),
    color = "darkslategrey"
  ) +
  labs(
    title = "Kaplan-Meier estimate",
    x = "t",
    y = "S(t)"
  ) +
  theme_bw()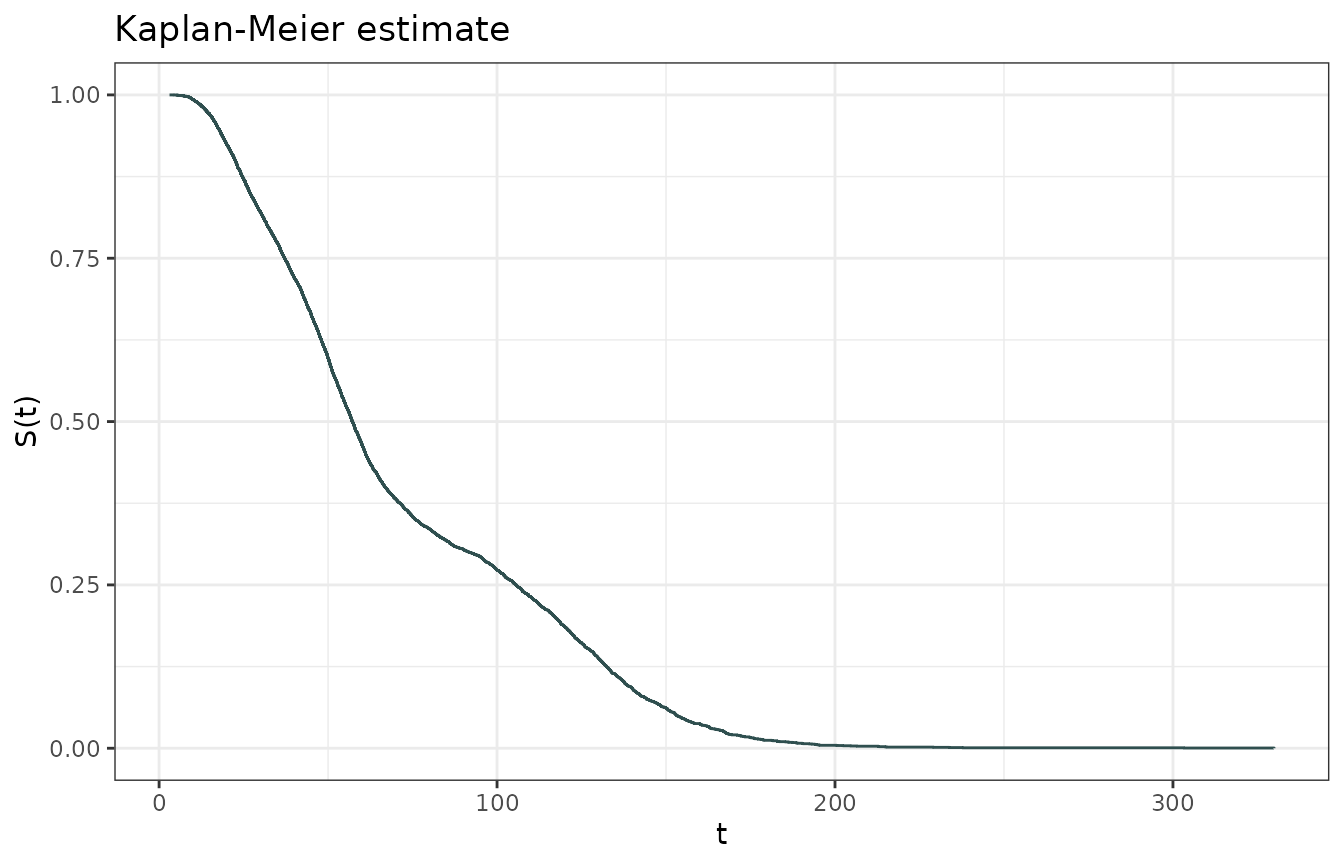
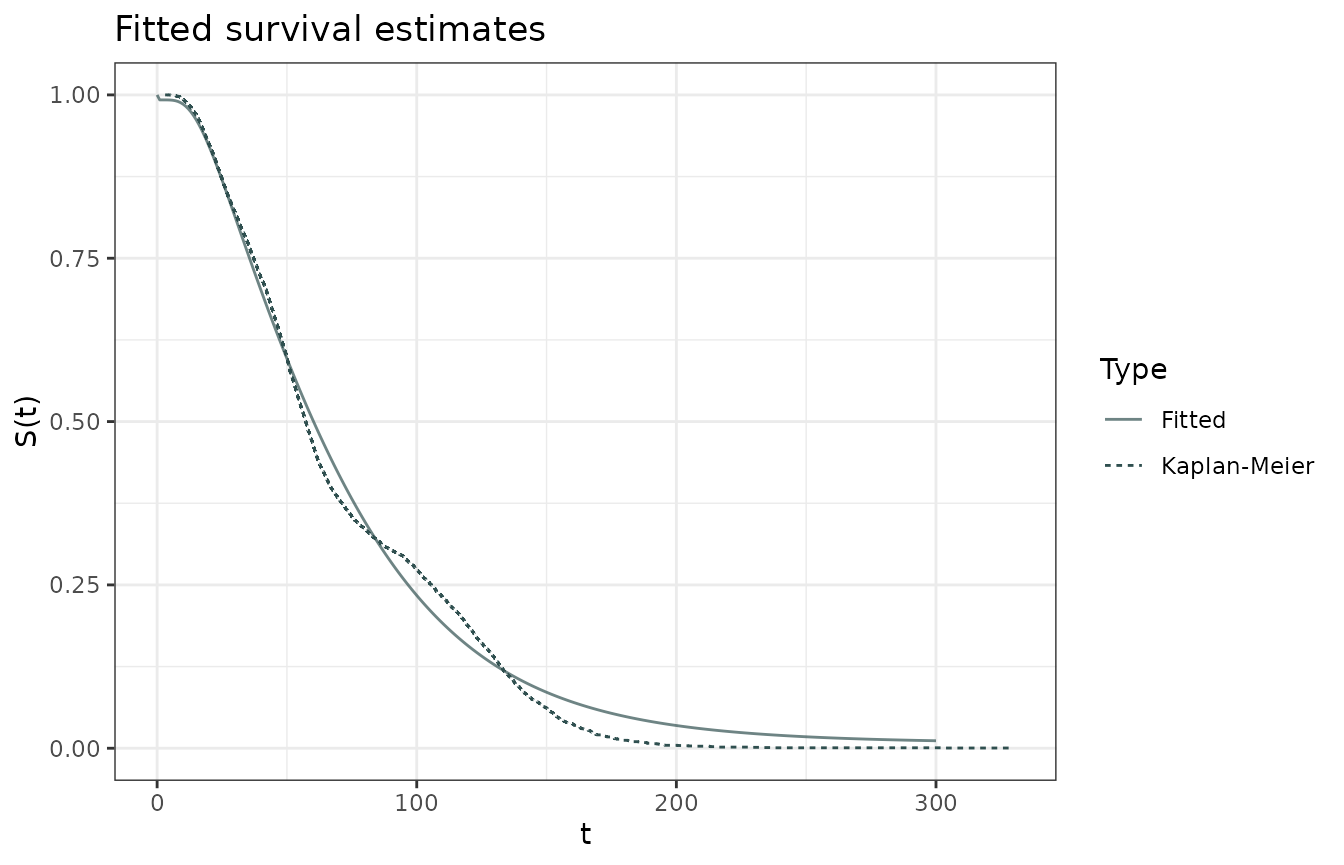
The predictions can be easily made with a “empty” data.frame with one row.
predictions <- predict(mod1,
  new_data = data.frame(val = NA),
  type = "survival",
  eval_time = seq(0, 300)
) |>
  tidyr::unnest(cols = .pred)
ggplot2 can be used to visualize the model’s fitted
survival estimates for the data.
ggplot() +
  geom_step(aes(x = time, y = estimate, linetype = "Kaplan-Meier"),
    color = "darkslategrey", data = km
  ) +
  geom_line(aes(x = .eval_time, y = .pred_survival, linetype = "Fitted"),
    color = "darkslategrey",
    data = predictions, alpha = 0.7
  ) +
  labs(
    title = "Fitted survival estimates",
    x = "t",
    y = "S(t)",
    linetype = "Type"
  ) +
  theme_bw()